0 Annex 1 - are you in Control?
- Porous Sterilisers
- by Kevin Peacock
- 02-04-2024
Annex 1 lists the essential expectations. However, to mitigate risk into the green zone, a more robust and integrated sterilization process control strategy is recommended, based upon sound and long established best practices.
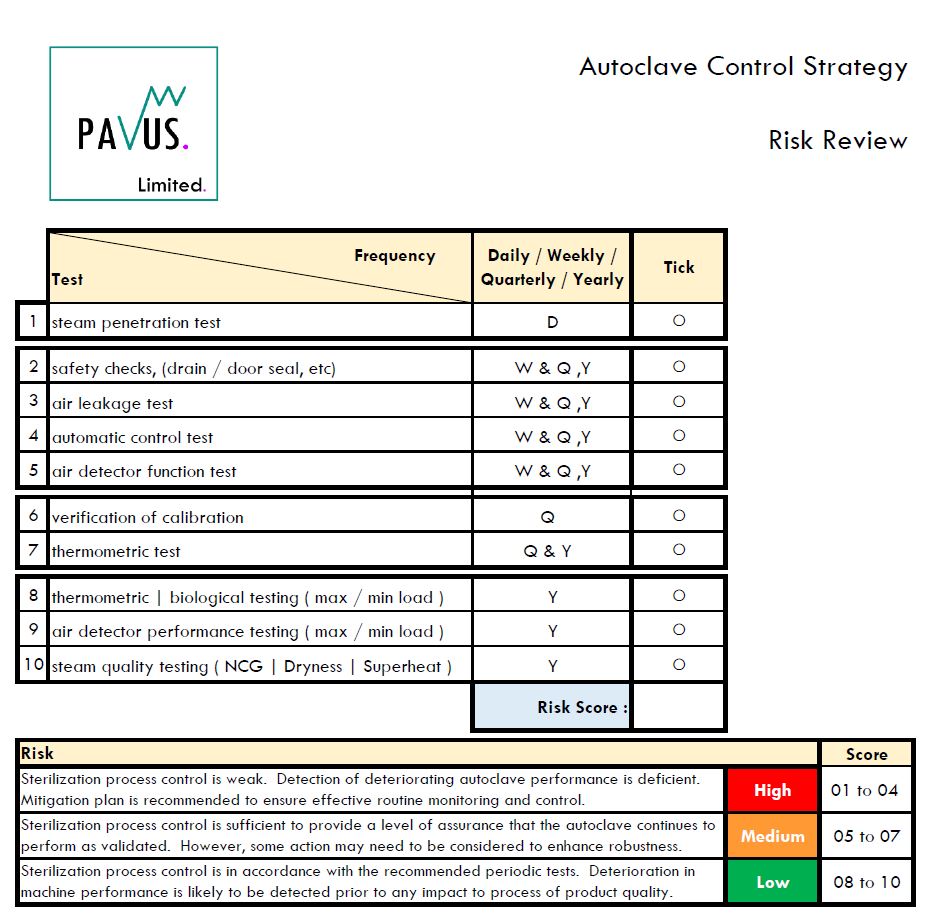
- Inspecting or auditing a porous load autoclave?
- How robust is the autoclave control strategy?
- Complete my check list and determine the risk score?
If the score is in the red or low orange the sterilization process may be at risk.
Sterilization is a core pillar in the contamination control strategy;
- A quick assessment using the 10-point checklist below is recommended, which helps determine how robust the routine monitoring and control of the autoclave is.
- Periodic steam penetration tests, air leakage testing, annual requalification of load patterns and steam supply testing is not enough.
- More is required to provide assurance that the process continues to perform as validated and within defined permitted limits. Data is key in being able to trend autoclave performance.
- The recommended periodic tests have been there for many years in the UK and in the standards, and we should not be selective in what we do or do not do. As I have mentioned in recent technical notes on Annex 1 changes, the required tests are mutually dependent to provide a clear picture to the user of the ongoing performance of the autoclave. If you are selective in the testing performed, the full and complete picture is not apparent and therefore the early detection of a risk/problem as a consequence is reduced.
Zimmermann recently said at the ISPE Aseptic Conference: -
“Know what you do and why, and what the consequences might be if you would not do it”. ISPE Aseptic Conference.
Choosing to not follow long established best practice has consequences when it comes to understanding process failure, determination of root cause and effective CAPA.
Understanding the gaps in your control strategy and risks for contamination to enter your process is key. Identify what you are doing; you may have a sterilisation process that works but you must understand how it works and where the boundaries are and of the critical control points that maintain a safe and effective sterilization service. You need the collective data generated from the full and complete set of periodic testing in order to demonstrate performance and control, not just annually but daily and weekly.
Sterilization process control, key points to consider: -
1.Integrity of data.
The nature and frequency of periodic tests, sufficient to give an overall view of the sterilization process performance. Not performing tests in isolation by differing stakeholders, but as part of an integrated testing strategy, performed and reported by a competent, skilled and knowledgeable test person.
2. Data Recording.
Simple standardized forms, designed to capture the most relevant sterilization process data are recommended, allowing the test person to collate and present the data in a transparent and meaningful format that demonstrates continued performance and compliance.
3. Data evaluation.
Who is evaluating the data? Are they trained and qualified to perform the tests, to review the data and is the person checking the data an appropriately skilled and qualified person? Quality oversight and approval by a sterilisation SME who has demonstrable knowledge, experience and training is highly recommended. Collectively the individuals in the chain of responsibility should be able to identify and pre-empt potential issues before they manifest and be able to confidently dismiss risk to product quality or patient safety. This can only be assured where the correct testing and their frequencies are being performed.
4. Trend analysis.
Data from a single test is often not significant, (a satisfactory annual Requalification test is not confirmation that the autoclave has performed within acceptable limits for the previous 12months). Furthermore, sterilization processes will have a degree of variability, (whilst operating within defined and validated permitted tolerances). Therefore, graphic presentation of results collected over time should be considered, to distinguish cycle variation from trends or in indicating a significant change in process has occurred, even though the data may fall within specified permitted tolerances.
Thank you for reading and please check out my recent technical notes on the subject of Annex 1 changes here: -
Technical Note 01 - Annex 1 - Sterilization - 8.36, 8.52, 8.57, 8.58 & 8.59
Technical Note 02 - Annex 1 - Load Patterns - 8.38, 8.39, 8.40 & 8.61
Technical Note 03 - Annex 1 - Automatic Control Test - 8.35 & 8.41
Technical Note 04 - Annex 1 - Air Detecting Systems - 8.61
If you are about to conduct a self inspection or wish to discuss further your test strategy and how to report your data, then contact me directly at the following email address: -
Thanks,